ngxtop è uno strumento di monitoraggio gratuito, open source, flessibile e in tempo reale per i server web Nginx. Può analizzare il registro di accesso di Nginx e stampare le informazioni sul conteggio delle richieste, l'URI richiesto, il numero di richieste per codice di stato e molto altro. È uno strumento semplice e facile da usare per monitorare le richieste che arrivano a un server web Nginx.
In questo articolo, ti mostrerò come installare e utilizzare lo strumento di monitoraggio ngxtop su Ubuntu 20.04.
Prerequisiti
- Un server che esegue Ubuntu 20.04.
- Sul tuo server è configurata una password di root.
Installa ngxtop
ngxtop è uno strumento basato su Python, quindi dovrai installare i pacchetti Python e PIP sul tuo sistema. Puoi installarli con Nginx usando il seguente comando:
apt-get install nginx python3 python3-pip -y
Una volta installato, puoi installare il pacchetto ngxtop utilizzando il PIP come mostrato di seguito:
pip3 install ngxtop
Una volta installato ngxtop, puoi verificare la versione di ngxtop utilizzando il seguente comando:
ngxtop --version
Dovresti ottenere il seguente output:
xstat 0.1
Come usare ngxtop
In questa sezione, ti mostreremo come utilizzare ngxtop per monitorare il server web Nginx.
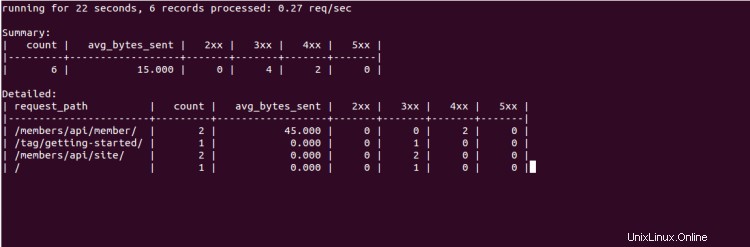
Esegui il comando ngxtop senza alcun argomento visualizzerà il riepilogo del conteggio delle richieste, l'URI richiesto, il numero di richieste per codice di stato.
ngxtop
Dovresti vedere la seguente schermata:

È possibile utilizzare l'opzione -l per specificare il registro di accesso che si desidera analizzare.
ngxtop -l /var/log/nginx/access.log
Dovresti vedere la seguente schermata:

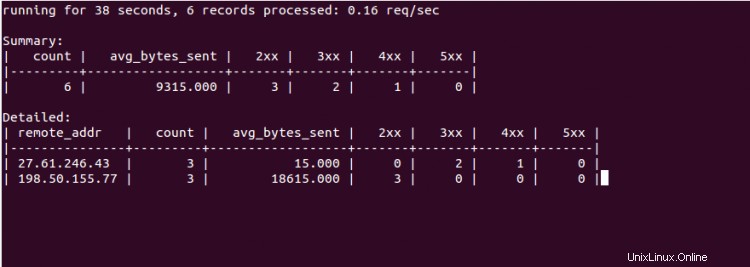
Per elencare i principali IP che accedono al tuo server Nginx, esegui il seguente comando:
ngxtop --group-by remote_addr -l /var/log/nginx/access.log
Dovresti vedere la seguente schermata:
Puoi stampare 10 richieste con il numero totale di byte inviato più alto utilizzando il seguente comando:
ngxtop --order-by 'avg(bytes_sent) * count' -l /var/log/nginx/access.log
Dovresti vedere la seguente schermata:
ngxtop consente anche di analizzare il file di registro di Apache da un server remoto. Puoi farlo con il seguente comando:
ssh [email protected] tail -f /var/log/apache2/access.log | ngxtop -f common
Per ottenere un elenco di tutte le opzioni disponibili con ngxtop, eseguire il comando seguente:
ngxtop --help
Dovresti vedere il seguente output:
ngxtop - ad-hoc query for nginx access log.

Usage:
    ngxtop [options]
    ngxtop [options] (print|top|avg|sum)  ...
    ngxtop info
    ngxtop [options] query  ...

Options:
    -l , --access-log   access log file to parse.
    -f , --log-format   log format as specify in log_format directive. [default: combined]
    --no-follow  ngxtop default behavior is to ignore current lines in log
                     and only watch for new lines as they are written to the access log.
                     Use this flag to tell ngxtop to process the current content of the access log instead.
    -t , --interval   report interval when running in follow mode [default: 2.0]

    -g , --group-by   group by variable [default: request_path]
    -w , --having   having clause [default: 1]
    -o , --order-by   order of output for default query [default: count]
    -n , --limit   limit the number of records included in report for top command [default: 10]
    -a  ..., --a  ...  add exp (must be aggregation exp: sum, avg, min, max, etc.) into output

    -v, --verbose  more verbose output
    -d, --debug  print every line and parsed record
    -h, --help  print this help message.
    --version  print version information.

    Advanced / experimental options:
    -c , --config   allow ngxtop to parse nginx config file for log format and location.
    -i , --filter   filter in, records satisfied given expression are processed.
    -p , --pre-filter  in-filter expression to check in pre-parsing phase.

Examples:
    All examples read nginx config file for access log location and format.
    If you want to specify the access log file and / or log format, use the -f and -a options.

    "top" like view of nginx requests
    $ ngxtop

    Top 10 requested path with status 404:
    $ ngxtop top request_path --filter 'status == 404'

    Top 10 requests with highest total bytes sent
    $ ngxtop --order-by 'avg(bytes_sent) * count'

    Top 10 remote address, e.g., who's hitting you the most
    $ ngxtop --group-by remote_addr

    Print requests with 4xx or 5xx status, together with status and http referer
    $ ngxtop -i 'status >= 400' print request status http_referer

    Average body bytes sent of 200 responses of requested path begin with 'foo':
    $ ngxtop avg bytes_sent --filter 'status == 200 and request_path.startswith("foo")'

    Analyze apache access log from remote machine using 'common' log format
    $ ssh remote tail -f /var/log/apache2/access.log | ngxtop -f common
Conclusione
Nella guida sopra, hai imparato come installare e utilizzare ngxtop su Ubuntu 20.04. Spero che ora tu possa monitorare facilmente il tuo registro Nginx dall'interfaccia della riga di comando.