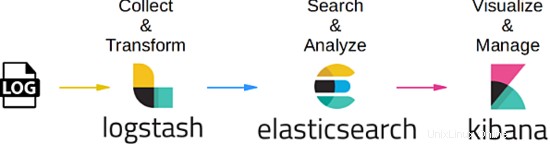
Questo tutorial spiega come configurare un server di gestione dei file di registro centralizzato utilizzando lo stack ELK su CentOS 7. Come chiunque non lo sappia già, ELK è la combinazione di 3 servizi:ElasticSearch, Logstash e Kibana. Per creare un server di gestione dei registri centralizzato completo utilizzando questo concetto, sarebbe necessario disporre di ciascuno di questi pacchetti poiché ha uno scopo diverso e correlato tra loro. Fondamentalmente funziona insieme in questo modo:
- Per ogni cliente che desideri gestire, produrrà il proprio registro dei servizi correlati.
- Per il server che verrà utilizzato per gestire tutte le informazioni di registrazione da ciascun client, utilizzerà il pacchetto LogStash per raccogliere e trasformare i dati in un valore relativo. Per definizione, è una pipeline di elaborazione dati lato server open source che acquisisce dati da una moltitudine di fonti contemporaneamente, li trasforma
- Una volta raccolti e trasformati i dati, il server di gestione utilizzerà ElasticSearch per aiutare e analizzare i dati per ottenere un valore rilevante. Puoi utilizzare il linguaggio di query generale se desideri produrre un rapporto correlato secondo necessità
- Poiché i dati correlati sono stati verificati e analizzati, è qui che il pacchetto Kibana viene in primo piano in quanto può aiutare a visualizzare e gestire i dati rilevanti per una visualizzazione corretta o combinarli in un dashboard lucido desiderabile per una facile comprensione.
L'immagine sotto riassume il processo del flusso di lavoro:
1. Nota preliminare
Per questo tutorial, sto usando CentOS Linux 7.4 nella versione a 64 bit. In questo tutorial utilizzeremo 3 server:il primo verrà utilizzato come server di gestione e gli altri 2 verranno usati come client. Per questo esercizio, utilizzeremo il server di gestione per monitorare un servizio MySQL esistente che è già stato impostato, configurato ed eseguito in ciascun client. Poiché MySQL è un servizio di database utilizzato principalmente per scopi OLTP, faremo in modo che il nostro server di gestione registri 2 processi di registrazione che sono il controllo dello stato del servizio MySQL stesso e la transazione lenta della query. Alla fine di questo tutorial, vedremo che tutte le informazioni registrate da qualsiasi servizio MySQL all'interno del client dedicato possono essere viste, visualizzate e analizzate contemporaneamente dal server di gestione direttamente in tempo reale.
2. Fase di installazione
Per la fase di installazione, inizieremo con l'installazione di FileBeat su entrambi i server DB MySQL che fungono da client. Iniziamo il processo, di seguito sono riportati i passaggi:
 [[email protected]_db1 opt]# cd
[[email protected]_db1 ~]# cd /opt/
[[email protected]_db1 opt]# wget https://artifacts.elastic.co/downloads/beats/filebeat/filebeat-6.2.1-x86_64.rpm
--2018-06-09 10:50:46-- https://artifacts.elastic.co/downloads/beats/filebeat/filebeat-6.2.1-x86_64.rpm
Resolving artifacts.elastic.co (artifacts.elastic.co)... 107.21.237.188, 107.21.253.15, 184.73.245.233, ...
Connecting to artifacts.elastic.co (artifacts.elastic.co)|107.21.237.188|:443... connected.
HTTP request sent, awaiting response... 200 OK
Length: 12697093 (12M) [binary/octet-stream]
Saving to: ‘filebeat-6.2.1-x86_64.rpm’

100%[==============================================================================>] 12,697,093 2.20MB/s in 6.9s

2018-06-09 10:51:00 (1.75 MB/s) - ‘filebeat-6.2.1-x86_64.rpm’ saved [12697093/12697093]

[[email protected]_db1 opt]# yum localinstall -y filebeat-6.2.1-x86_64.rpm
Loaded plugins: fastestmirror, ovl
Examining filebeat-6.2.1-x86_64.rpm: filebeat-6.2.1-1.x86_64
Marking filebeat-6.2.1-x86_64.rpm to be installed
Resolving Dependencies
--> Running transaction check
---> Package filebeat.x86_64 0:6.2.1-1 will be installed
--> Finished Dependency Resolution

Dependencies Resolved

========================================================================================================================
Package Arch Version Repository Size
========================================================================================================================
Installing:
filebeat x86_64 6.2.1-1 /filebeat-6.2.1-x86_64 49 M

Transaction Summary
========================================================================================================================
Install 1 Package

Total size: 49 M
Installed size: 49 M
Downloading packages:
Running transaction check
Running transaction test
Transaction test succeeded
Running transaction
Installing : filebeat-6.2.1-1.x86_64 1/1
Verifying : filebeat-6.2.1-1.x86_64 1/1

Installed:
filebeat.x86_64 0:6.2.1-1

Complete!
Una volta terminato, elencheremo il modulo predefinito che abilita dal pacchetto FileBeat e abiliteremo il modulo mysql necessario per i nostri casi qui. Di seguito sono riportati i passaggi:
 [[email protected]_db1 opt]# filebeat modules list
Enabled:

Disabled:
apache2
auditd
icinga
kafka
logstash
mysql
nginx
osquery
postgresql
redis
system
traefik
[[email protected]_db1 opt]# filebeat modules enable mysql
Enabled mysql
Fatto, ora modifichiamo la configurazione necessaria per il modulo mysql che abbiamo abilitato proprio ora. Per impostazione predefinita, una volta abilitato il modulo mysql dal pacchetto filebeat, verrà creato automaticamente un file yaml all'interno della directory modules.d. Tuttavia, se il file non è stato creato, sentiti libero di creare un nuovo file yaml nella stessa posizione. Di seguito sono riportati i passaggi:
 [[email protected]_db1 opt]# vi /etc/filebeat/modules.d/mysql.yml
- module: mysql
error:
enabled: true
var.paths: ["/var/lib/mysql/mysql-error.log*"]

slowlog:
enabled: true
var.paths: ["/var/lib/mysql/log-slow-queries.log*"]
Come mostrato sopra, abbiamo deciso di registrare 2 processi di registrazione dal servizio MySQL che è il controllo dello stato del database stesso e il registro delle query lente.
Ora, una volta terminato tutto, eseguiamo alcune configurazioni all'interno del file di configurazione principale per filebeat nel file filebeat.yml. Di seguito sono riportati i set di configurazione:
 [[email protected]_db1 opt]# vi /etc/filebeat/filebeat.yml
#=========================== Filebeat prospectors =============================

filebeat.prospectors:

- type: log

enabled: false
paths:
- /var/lib/mysql/mysql-error.log
- /var/lib/mysql/log-slow-queries.log

#============================= Filebeat modules ===============================

filebeat.config.modules:
path: ${path.config}/modules.d/*.yml
reload.enabled: false

#==================== Elasticsearch template setting ==========================

setup.template.settings:
index.number_of_shards: 3

#================================ General =====================================

setup.kibana:

#----------------------------- Logstash output --------------------------------
output.logstash:
hosts: ["172.17.0.6:5044"]
Nota su quanto sopra che abbiamo impostato un indirizzo IP per l'host logstash che è 172.17.0.6. Questo IP è l'indirizzo per il nostro server di gestione centralizzato che eseguirà la scansione diretta per raccogliere i dati di registrazione. Ho impostato l'IP hardcoded poiché non ho apportato modifiche alternative nel file /etc/hosts e non ho utilizzato alcun server DNS per questo tutorial. Tuttavia, sentiti libero di utilizzare il nome host del server di gestione se hai apportato le modifiche alternative.
Poiché tutto è stato impostato come da piano, avviamo i servizi di filebeat. Di seguito sono riportati i passaggi:
 [[email protected]_db1 opt]# filebeat setup -e
2018-06-09T11:04:37.277Z INFO instance/beat.go:468 Home path: [/usr/share/filebeat] Config path: [/etc/filebeat] Data path: [/var/lib/filebeat] Logs path: [/var/log/filebeat]
2018-06-09T11:04:37.277Z INFO instance/beat.go:475 Beat UUID: 98503460-035e-4476-8e4d-10470433dba5
2018-06-09T11:04:37.277Z INFO instance/beat.go:213 Setup Beat: filebeat; Version: 6.2.1
2018-06-09T11:04:37.277Z INFO pipeline/module.go:76 Beat name: lara
2018-06-09T11:04:37.278Z ERROR instance/beat.go:667 Exiting: Template loading requested but the Elasticsearch output is not configured/enabled
Exiting: Template loading requested but the Elasticsearch output is not configured/enabled


[[email protected]_db1 opt]# filebeat -e &
[1] 22010
[[email protected]_db1 opt]# 2018-06-09T12:45:18.812Z INFO instance/beat.go:468 Home path: [/usr/share/filebeat] Config path: [/etc/filebeat] Data path: [/var/lib/filebeat] Logs path: [/var/log/filebeat]
2018-06-09T12:45:18.813Z INFO instance/beat.go:475 Beat UUID: 98503460-035e-4476-8e4d-10470433dba5
2018-06-09T12:45:18.813Z INFO instance/beat.go:213 Setup Beat: filebeat; Version: 6.2.1
2018-06-09T12:45:18.813Z INFO pipeline/module.go:76 Beat name: lara
2018-06-09T12:45:18.813Z INFO [monitoring] log/log.go:97 Starting metrics logging every 30s
2018-06-09T12:45:18.813Z INFO instance/beat.go:301 filebeat start running.
2018-06-09T12:45:18.814Z INFO registrar/registrar.go:71 No registry file found under: /var/lib/filebeat/registry. Creating a new registry file.
2018-06-09T12:45:18.819Z INFO registrar/registrar.go:108 Loading registrar data from /var/lib/filebeat/registry
2018-06-09T12:45:18.819Z INFO registrar/registrar.go:119 States Loaded from registrar: 0
2018-06-09T12:45:18.819Z WARN beater/filebeat.go:261 Filebeat is unable to load the Ingest Node pipelines for the configured modules because the Elasticsearch output is not configured/enabled. If you have already loaded the Ingest Node pipelines or are using Logstash pipelines, you can ignore this warning.
2018-06-09T12:45:18.820Z INFO crawler/crawler.go:48 Loading Prospectors: 1
2018-06-09T12:45:18.821Z INFO log/prospector.go:111 Configured paths: [/var/lib/mysql/log-slow-queries.log*]
2018-06-09T12:45:18.822Z INFO log/prospector.go:111 Configured paths: [/var/lib/mysql/mysql-error.log*]
2018-06-09T12:45:18.822Z INFO crawler/crawler.go:82 Loading and starting Prospectors completed. Enabled prospectors: 0
2018-06-09T12:45:18.822Z INFO cfgfile/reload.go:127 Config reloader started
2018-06-09T12:45:18.840Z INFO log/prospector.go:111 Configured paths: [/var/lib/mysql/log-slow-queries.log*]
2018-06-09T12:45:18.840Z INFO log/prospector.go:111 Configured paths: [/var/lib/mysql/mysql-error.log*]
2018-06-09T12:45:18.840Z INFO cfgfile/reload.go:258 Starting 1 runners ...
2018-06-09T12:45:18.840Z INFO cfgfile/reload.go:219 Loading of config files completed.
2018-06-09T12:45:18.841Z INFO log/harvester.go:216 Harvester started for file: /var/lib/mysql/mysql-error.log
2018-06-09T12:45:18.841Z INFO log/harvester.go:216 Harvester started for file: /var/lib/mysql/log-slow-queries.log
2018-06-09T12:45:20.841Z ERROR pipeline/output.go:74 Failed to connect: dial tcp 172.17.0.6:5044: getsockopt: connection refused
2018-06-09T12:45:22.842Z ERROR pipeline/output.go:74 Failed to connect: dial tcp 172.17.0.6:5044: getsockopt: connection refused
2018-06-09T12:45:26.842Z ERROR pipeline/output.go:74 Failed to connect: dial tcp 172.17.0.6:5044: getsockopt: connection refused


[[email protected]_db1 ~]# tail -f /var/log/filebeat/filebeat
2018-06-09T10:53:28.853Z INFO instance/beat.go:468 Home path: [/usr/share/filebeat] Config path: [/etc/filebeat] Data path: [/var/lib/filebeat] Logs path: [/var/log/filebeat]
2018-06-09T10:53:28.853Z INFO instance/beat.go:475 Beat UUID: 98503460-035e-4476-8e4d-10470433dba5
Si noti che una volta avviato il servizio filebeat, viene visualizzato un errore nel registro. Ciò era dovuto al fatto che il server di gestione assegnato non era ancora configurato. Per la fase iniziale puoi ignorare il registro degli errori poiché verrà ripristinato automaticamente una volta che il nostro server di gestione è stato configurato e ha iniziato a eseguire la scansione.
Al termine della configurazione per la base di client, puoi continuare a replicare i passaggi sull'altro server MySQL che funge anche da client.
Andando avanti, continueremo con la configurazione del server di gestione stesso.
3. Fase di installazione (lato server di gestione centralizzata)
Ora, dopo aver completato la configurazione per la disponibilità lato client, avviamo la configurazione necessaria per il server di gestione stesso. In breve, ci sono 3 pacchetti principali che devono essere installati e configurati per il server di gestione che è ElasticSearch, LogStash e Kibana.
Per questa fase, inizieremo prima l'installazione e la configurazione necessarie per ElasticSearch, di seguito sono riportati i passaggi:
 [[email protected]_master ~]# cd /opt/
[[email protected]_master opt]# ls
[[email protected]_master opt]# wget https://artifacts.elastic.co/downloads/elasticsearch/elasticsearch-6.2.1.tar.gz
--2018-06-09 12:47:59-- https://artifacts.elastic.co/downloads/elasticsearch/elasticsearch-6.2.1.tar.gz
Resolving artifacts.elastic.co (artifacts.elastic.co)... 107.21.237.188, 54.235.82.130, 107.21.253.15, ...
Connecting to artifacts.elastic.co (artifacts.elastic.co)|107.21.237.188|:443... connected.
HTTP request sent, awaiting response... 200 OK
Length: 29049089 (28M) [binary/octet-stream]
Saving to: ‘elasticsearch-6.2.1.tar.gz’

100%[==============================================================================>] 29,049,089 2.47MB/s in 16s

2018-06-09 12:48:21 (1.76 MB/s) - ‘elasticsearch-6.2.1.tar.gz’ saved [29049089/29049089]

[[email protected]_master opt]#
[[email protected]_master opt]#
[[email protected]_master opt]# tar -zxvf elasticsearch-6.2.1.tar.gz

[[email protected]_master opt]# ln -s /opt/elasticsearch-6.2.1 /opt/elasticsearch
[[email protected]_master opt]# ll
total 28372
lrwxrwxrwx 1 root root 24 Jun 9 12:49 elasticsearch -> /opt/elasticsearch-6.2.1
drwxr-xr-x 8 root root 143 Feb 7 19:36 elasticsearch-6.2.1
-rw-r--r-- 1 root root 29049089 May 15 04:56 elasticsearch-6.2.1.tar.gz
Al termine dell'installazione di elasticsearch, proseguiamo con la parte di configurazione. Per quanto riguarda la configurazione, assegneremo la directory /data/data per memorizzare i dati di registrazione raccolti che sono stati analizzati. La directory stessa verrà utilizzata anche per archiviare l'indice che verrà utilizzato da elasticSearch stesso per query più rapide. Per la directory /data/logs verrà utilizzato da elasticSearch stesso per il proprio scopo di registrazione. Di seguito sono riportati i passaggi:
 [[email protected]_master opt]# mkdir -p /data/data
[[email protected]_master opt]# mkdir -p /data/logs
[[email protected]_master opt]#
[[email protected]_master opt]# cd elasticsearch
[[email protected]_master elasticsearch]# ls
bin config lib LICENSE.txt logs modules NOTICE.txt plugins README.textile
[[email protected]_master elasticsearch]# cd config/
[[email protected]_master config]# vi elasticsearch.yml
# ---------------------------------- Cluster -----------------------------------
cluster.name: log_cluster
#
# ------------------------------------ Node ------------------------------------
#
node.name: elk_master
#
# ----------------------------------- Paths ------------------------------------
#
path.data: /data/data
path.logs: /data/logs
#
network.host: 172.17.0.6
Fatto, affinché ElasticSearch funzioni, è necessaria la configurazione di Java. Di seguito sono riportati i passaggi per l'installazione e la configurazione di Java nel server.
 [[email protected]_master config]# wget --no-cookies --no-check-certificate --header "Cookie: gpw_e24=http%3A%2F%2Fwww.oracle.com%2F; oraclelicense=accept-securebackup-cookie" "http://download.oracle.com/otn-pub/java/jdk/8u131-b11/d54c1d3a095b4ff2b6607d096fa80163/jdk-8u131-linux-x64.rpm"
--2018-06-09 12:57:05-- http://download.oracle.com/otn-pub/java/jdk/8u131-b11/d54c1d3a095b4ff2b6607d096fa80163/jdk-8u131-linux-x64.rpm
Resolving download.oracle.com (download.oracle.com)... 23.49.16.62
Connecting to download.oracle.com (download.oracle.com)|23.49.16.62|:80... connected.
HTTP request sent, awaiting response... 302 Moved Temporarily
Location: https://edelivery.oracle.com/otn-pub/java/jdk/8u131-b11/d54c1d3a095b4ff2b6607d096fa80163/jdk-8u131-linux-x64.rpm [following]
--2018-06-09 12:57:10-- https://edelivery.oracle.com/otn-pub/java/jdk/8u131-b11/d54c1d3a095b4ff2b6607d096fa80163/jdk-8u131-linux-x64.rpm
Resolving edelivery.oracle.com (edelivery.oracle.com)... 104.103.48.174, 2600:1417:58:181::2d3e, 2600:1417:58:188::2d3e
Connecting to edelivery.oracle.com (edelivery.oracle.com)|104.103.48.174|:443... connected.
HTTP request sent, awaiting response... 302 Moved Temporarily
Location: http://download.oracle.com/otn-pub/java/jdk/8u131-b11/d54c1d3a095b4ff2b6607d096fa80163/jdk-8u131-linux-x64.rpm?AuthParam=1528549151_b1fd01d854bc0423600a83c36240028e [following]
--2018-06-09 12:57:11-- http://download.oracle.com/otn-pub/java/jdk/8u131-b11/d54c1d3a095b4ff2b6607d096fa80163/jdk-8u131-linux-x64.rpm?AuthParam=1528549151_b1fd01d854bc0423600a83c36240028e
Connecting to download.oracle.com (download.oracle.com)|23.49.16.62|:80... connected.
HTTP request sent, awaiting response... 200 OK
Length: 169983496 (162M) [application/x-redhat-package-manager]
Saving to: ‘jdk-8u131-linux-x64.rpm’

100%[==============================================================================>] 169,983,496 2.56MB/s in 64s

2018-06-09 12:58:15 (2.54 MB/s) - ‘jdk-8u131-linux-x64.rpm’ saved [169983496/169983496]

[[email protected]_master config]# yum localinstall -y jdk-8u131-linux-x64.rpm


[[email protected]_master config]# vi /root/.bash_profile
export JAVA_HOME=/usr/java/jdk1.8.0_131
PATH=$JAVA_HOME/bin:$PATH:$HOME/bin
export PATH

[[email protected]_master config]# . /root/.bash_profile
[[email protected]_master config]# java -version
java version "1.8.0_131"
Java(TM) SE Runtime Environment (build 1.8.0_131-b11)
Java HotSpot(TM) 64-Bit Server VM (build 25.131-b11, mixed mode)
Fatto, ora elasticSearch è stato installato e configurato nel server. Tuttavia, a causa di alcune politiche di sicurezza, elasticSearch non può essere eseguito dall'utente root, pertanto creeremo un utente aggiuntivo come proprietario del servizio elasticSearch ed eseguirlo. Di seguito sono riportati i passaggi per creare l'utente dedicato:
 [[email protected]_master config]# useradd -s /bin/bash shahril
[[email protected]_master config]# passwd shahril
Changing password for user shahril.
New password:
BAD PASSWORD: The password fails the dictionary check - it is too simplistic/systematic
Retype new password:
passwd: all authentication tokens updated successfully.

[[email protected]_master config]# chown -R shahril:shahril /data/
[[email protected]_master config]# sysctl -w vm.max_map_count=262144
vm.max_map_count = 262144
Al termine, accedi come utente e potrai avviare i servizi elasticSearch.
 [[email protected]_master config]# su - shahril
Last login: Sat Jun 9 13:03:07 UTC 2018 on pts/1
[[email protected]_master ~]$
[[email protected]_master ~]$
[[email protected]_master ~]$
[[email protected]_master ~]$ /opt/elasticsearch/bin/elasticsearch &
[1] 7295
[[email protected]_master ~]$ [2018-06-09T13:06:26,667][INFO ][o.e.n.Node ] [elk_master] initializing ...
[2018-06-09T13:06:26,721][INFO ][o.e.e.NodeEnvironment ] [elk_master] using [1] data paths, mounts [[/ (rootfs)]], net usable_space [394.3gb], net total_space [468.2gb], types [rootfs]
[2018-06-09T13:06:26,722][INFO ][o.e.e.NodeEnvironment ] [elk_master] heap size [990.7mb], compressed ordinary object pointers [true]
[2018-06-09T13:06:26,723][INFO ][o.e.n.Node ] [elk_master] node name [elk_master], node ID [xjNoA9mMSGiXYmFPRNlXBg]
[2018-06-09T13:06:26,723][INFO ][o.e.n.Node ] [elk_master] version[6.2.1], pid[7295], build[7299dc3/2018-02-07T19:34:26.990113Z], OS[Linux/3.10.0-693.17.1.el7.x86_64/amd64], JVM[Oracle Corporation/Java HotSpot(TM) 64-Bit Server VM/1.8.0_131/25.131-b11]
[2018-06-09T13:06:26,723][INFO ][o.e.n.Node ] [elk_master] JVM arguments [-Xms1g, -Xmx1g, -XX:+UseConcMarkSweepGC, -XX:CMSInitiatingOccupancyFraction=75, -XX:+UseCMSInitiatingOccupancyOnly, -XX:+AlwaysPreTouch, -Xss1m, -Djava.awt.headless=true, -Dfile.encoding=UTF-8, -Djna.nosys=true, -XX:-OmitStackTraceInFastThrow, -Dio.netty.noUnsafe=true, -Dio.netty.noKeySetOptimization=true, -Dio.netty.recycler.maxCapacityPerThread=0, -Dlog4j.shutdownHookEnabled=false, -Dlog4j2.disable.jmx=true, -Djava.io.tmpdir=/tmp/elasticsearch.U6ilAwt9, -XX:+HeapDumpOnOutOfMemoryError, -XX:+PrintGCDetails, -XX:+PrintGCDateStamps, -XX:+PrintTenuringDistribution, -XX:+PrintGCApplicationStoppedTime, -Xloggc:logs/gc.log, -XX:+UseGCLogFileRotation, -XX:NumberOfGCLogFiles=32, -XX:GCLogFileSize=64m, -Des.path.home=/opt/elasticsearch, -Des.path.conf=/opt/elasticsearch/config]
[2018-06-09T13:06:27,529][INFO ][o.e.p.PluginsService ] [elk_master] loaded module [aggs-matrix-stats]
[2018-06-09T13:06:27,529][INFO ][o.e.p.PluginsService ] [elk_master] loaded module [analysis-common]
[2018-06-09T13:06:27,529][INFO ][o.e.p.PluginsService ] [elk_master] loaded module [ingest-common]
[2018-06-09T13:06:27,530][INFO ][o.e.p.PluginsService ] [elk_master] loaded module [lang-expression]
[2018-06-09T13:06:27,530][INFO ][o.e.p.PluginsService ] [elk_master] loaded module [lang-mustache]
[2018-06-09T13:06:27,530][INFO ][o.e.p.PluginsService ] [elk_master] loaded module [lang-painless]
[2018-06-09T13:06:27,530][INFO ][o.e.p.PluginsService ] [elk_master] loaded module [mapper-extras]
[2018-06-09T13:06:27,530][INFO ][o.e.p.PluginsService ] [elk_master] loaded module [parent-join]
[2018-06-09T13:06:27,530][INFO ][o.e.p.PluginsService ] [elk_master] loaded module [percolator]
[2018-06-09T13:06:27,531][INFO ][o.e.p.PluginsService ] [elk_master] loaded module [rank-eval]
[2018-06-09T13:06:27,532][INFO ][o.e.p.PluginsService ] [elk_master] loaded module [reindex]
[2018-06-09T13:06:27,532][INFO ][o.e.p.PluginsService ] [elk_master] loaded module [repository-url]
[2018-06-09T13:06:27,533][INFO ][o.e.p.PluginsService ] [elk_master] loaded module [transport-netty4]
[2018-06-09T13:06:27,533][INFO ][o.e.p.PluginsService ] [elk_master] loaded module [tribe]
[2018-06-09T13:06:27,534][INFO ][o.e.p.PluginsService ] [elk_master] no plugins loaded
Eccellente, ora elasticSearch è attivo e funzionante senza alcun problema, noterai che sono state stabilite porte aggiuntive all'interno del server relative al servizio elasticSearch. Puoi verificare la porta elencata come di seguito:
 [[email protected]_master config]# netstat -apn|grep -i :9
tcp 0 0 172.17.0.6:9200 0.0.0.0:* LISTEN 7295/java
tcp 0 0 172.17.0.6:9300 0.0.0.0:* LISTEN 7295/java
Passiamo ora all'impostazione e alla configurazione dei servizi logstash. Di seguito sono riportati i passaggi necessari per il processo di installazione:
 [[email protected]_master opt]# wget https://artifacts.elastic.co/downloads/logstash/logstash-6.2.1.rpm
--2018-06-09 13:07:51-- https://artifacts.elastic.co/downloads/logstash/logstash-6.2.1.rpm
Resolving artifacts.elastic.co (artifacts.elastic.co)... 107.21.253.15, 23.21.67.46, 107.21.237.188, ...
Connecting to artifacts.elastic.co (artifacts.elastic.co)|107.21.253.15|:443... connected.
HTTP request sent, awaiting response... 200 OK
Length: 140430729 (134M) [binary/octet-stream]
Saving to: ‘logstash-6.2.1.rpm’

100%[==============================================================================>] 140,430,729 2.19MB/s in 60s

2018-06-09 13:08:57 (2.24 MB/s) - ‘logstash-6.2.1.rpm’ saved [140430729/140430729]

[[email protected]_master opt]# yum localinstall -y logstash-6.2.1.rpm
Loaded plugins: fastestmirror, ovl
Examining logstash-6.2.1.rpm: 1:logstash-6.2.1-1.noarch
Marking logstash-6.2.1.rpm to be installed
Resolving Dependencies
--> Running transaction check
---> Package logstash.noarch 1:6.2.1-1 will be installed
--> Finished Dependency Resolution

Dependencies Resolved

========================================================================================================================
Package Arch Version Repository Size
========================================================================================================================
Installing:
logstash noarch 1:6.2.1-1 /logstash-6.2.1 224 M

Transaction Summary
========================================================================================================================
Install 1 Package

Total size: 224 M
Installed size: 224 M
Downloading packages:
Running transaction check
Running transaction test
Transaction test succeeded
Running transaction
Installing : 1:logstash-6.2.1-1.noarch 1/1
Using provided startup.options file: /etc/logstash/startup.options
Successfully created system startup script for Logstash
Verifying : 1:logstash-6.2.1-1.noarch 1/1

Installed:
logstash.noarch 1:6.2.1-1

Complete!
Una volta completata l'installazione, applicare la configurazione necessaria come di seguito:
 [[email protected]_master opt]# vi /etc/logstash/conf.d/02-mysql-log.conf

input {
beats {
port => 5044
host => "0.0.0.0"
}
}


filter {
if [fileset][module] == "mysql" {
if [fileset][name] == "error" {
grok {
match => { "message" => ["%{LOCALDATETIME:[mysql][error][timestamp]} (\[%{DATA:[mysql][error][level]}\] )?%{GREEDYDATA:[mysql][error][message]}",
"%{TIMESTAMP_ISO8601:[mysql][error][timestamp]} %{NUMBER:[mysql][error][thread_id]} \[%{DATA:[mysql][error][level]}\] %{GREEDYDATA:[mysql][error][message1]}",
"%{GREEDYDATA:[mysql][error][message2]}"] }
pattern_definitions => {
"LOCALDATETIME" => "[0-9]+ %{TIME}"
}
remove_field => "message"
}
mutate {
rename => { "[mysql][error][message1]" => "[mysql][error][message]" }
}
mutate {
rename => { "[mysql][error][message2]" => "[mysql][error][message]" }
}
date {
match => [ "[mysql][error][timestamp]", "ISO8601", "YYMMdd H:m:s" ]
remove_field => "[mysql][error][time]"
}
}
else if [fileset][name] == "slowlog" {
grok {
match => { "message" => ["^# [email protected]: %{USER:[mysql][slowlog][user]}(\[[^\]]+\])? @ %{HOSTNAME:[mysql][slowlog][host]} \[(IP:[mysql][slowlog][ip])?\](\s*Id:\s* %{NUMBER:[mysql][slowlog][id]})?\n# Query_time: %{NUMBER:[mysql][slowlog][query_time][sec]}\s* Lock_time: %{NUMBER:[mysql][slowlog][lock_time][sec]}\s* Rows_sent: %{NUMBER:[mysql][slowlog][rows_sent]}\s* Rows_examined: %{NUMBER:[mysql][slowlog][rows_examined]}\n(SET timestamp=%{NUMBER:[mysql][slowlog][timestamp]};\n)?%{GREEDYMULTILINE:[mysql][slowlog][query]}"] }
pattern_definitions => {
"GREEDYMULTILINE" => "(.|\n)*"
}
remove_field => "message"
}
date {
match => [ "[mysql][slowlog][timestamp]", "UNIX" ]
}
mutate {
gsub => ["[mysql][slowlog][query]", "\n# Time: [0-9]+ [0-9][0-9]:[0-9][0-9]:[0-9][0-9](\\.[0-9]+)?$", ""]
}
}
}
}


output {
elasticsearch {
hosts => "172.17.0.6"
manage_template => false
index => "%{[@metadata][beat]}-%{[@metadata][version]}-%{+YYYY.MM.dd}"
}
}
Notato che dalla configurazione effettuata sopra, abbiamo impostato l'input da prelevare dal servizio filebeat sul lato client che utilizza la porta 5044. Abbiamo anche impostato un'annotazione appropriata per logstash per allineare i dati grezzi presi da ciascun lato client. Ciò è necessario affinché sia più facile essere visualizzati e analizzati dal lato elasticSearch.
Successivamente, dobbiamo installare il modulo filebeats per logstash in modo che logstash sia in grado di acquisire e scansionare i dati grezzi dal lato client.
 [[email protected]_master opt]# /usr/share/logstash/bin/logstash-plugin install logstash-input-beats
Validating logstash-input-beats
Installing logstash-input-beats
Installation successful
Al termine dell'installazione e della configurazione necessarie per logstash, possiamo avviare direttamente i servizi. Di seguito sono riportati i passaggi:
 [[email protected]_master opt]# service logstash restart
Redirecting to /bin/systemctl restart logstash.service

[[email protected]_master opt]# service logstash status
Redirecting to /bin/systemctl status logstash.service
? logstash.service - logstash
Loaded: loaded (/etc/systemd/system/logstash.service; disabled; vendor preset: disabled)
Active: active (running) since Sat 2018-06-09 13:17:40 UTC; 5s ago
Main PID: 8106 (java)
CGroup: /docker/2daaf895e0efa67ef70dbabd87b56d53815e94ff70432f692385f527e2dc488b/system.slice/logstash.service
??8106 /bin/java -Xms256m -Xmx1g -XX:+UseParNewGC -XX:+UseConcMarkSweepGC -XX:CMSInitiatingOccupancyFracti...

Jun 09 13:17:40 elk_master systemd[1]: Started logstash.
Jun 09 13:17:40 elk_master systemd[1]: Starting logstash...
[[email protected]_master opt]#

[[email protected]_master opt]# tail -f /var/log/logstash/logstash-plain.log
[2018-06-09T13:17:59,496][INFO ][logstash.outputs.elasticsearch] Elasticsearch pool URLs updated {:changes=>{:removed=>[], :added=>[http://172.17.0.6:9200/]}}
[2018-06-09T13:17:59,498][INFO ][logstash.outputs.elasticsearch] Running health check to see if an Elasticsearch connection is working {:healthcheck_url=>http://172.17.0.6:9200/, :path=>"/"}
[2018-06-09T13:17:59,976][WARN ][logstash.outputs.elasticsearch] Restored connection to ES instance {:url=>"http://172.17.0.6:9200/"}
[2018-06-09T13:18:00,083][INFO ][logstash.outputs.elasticsearch] ES Output version determined {:es_version=>nil}
[2018-06-09T13:18:00,083][WARN ][logstash.outputs.elasticsearch] Detected a 6.x and above cluster: the `type` event field won't be used to determine the document _type {:es_version=>6}
[2018-06-09T13:18:00,095][INFO ][logstash.outputs.elasticsearch] New Elasticsearch output {:class=>"LogStash::Outputs::ElasticSearch", :hosts=>["//172.17.0.6"]}
[2018-06-09T13:18:00,599][INFO ][logstash.inputs.beats ] Beats inputs: Starting input listener {:address=>"0.0.0.0:5044"}
[2018-06-09T13:18:00,652][INFO ][logstash.pipeline ] Pipeline started succesfully {:pipeline_id=>"main", :thread=>"#<Thread:[email protected]/usr/share/logstash/logstash-core/lib/logstash/pipeline.rb:246 sleep>"}
[2018-06-09T13:18:00,663][INFO ][org.logstash.beats.Server] Starting server on port: 5044
[2018-06-09T13:18:00,660][INFO ][logstash.agent ] Pipelines running {:count=>1, :pipelines=>["main"]}
[2018-06-09T13:18:24,060][INFO ][o.e.c.m.MetaDataCreateIndexService] [elk_master] [filebeat-6.2.1-2018.06.04] creating index, cause [auto(bulk api)], templates [], shards [5]/[1], mappings []
[2018-06-09T13:18:24,189][INFO ][o.e.c.m.MetaDataCreateIndexService] [elk_master] [filebeat-6.2.1-2018.06.09] creating index, cause [auto(bulk api)], templates [], shards [5]/[1], mappings []
[2018-06-09T13:18:24,288][INFO ][o.e.c.m.MetaDataCreateIndexService] [elk_master] [filebeat-6.2.1-2018.06.08] creating index, cause [auto(bulk api)], templates [], shards [5]/[1], mappings []
[2018-06-09T13:18:24,591][INFO ][o.e.c.m.MetaDataMappingService] [elk_master] [filebeat-6.2.1-2018.06.04/yPD91Ww0SD2ei4YI-FgLgQ] create_mapping [doc]
[2018-06-09T13:18:24,781][INFO ][o.e.c.m.MetaDataMappingService] [elk_master] [filebeat-6.2.1-2018.06.08/Qnv0gplFTgW0z1C6haZESg] create_mapping [doc]
[2018-06-09T13:18:24,882][INFO ][o.e.c.m.MetaDataMappingService] [elk_master] [filebeat-6.2.1-2018.06.09/dihjTJw3SjGncXYln2MXbA] create_mapping [doc]
[2018-06-09T13:18:24,996][INFO ][o.e.c.m.MetaDataMappingService] [elk_master] [filebeat-6.2.1-2018.06.09/dihjTJw3SjGncXYln2MXbA] update_mapping [doc]
As you can see, now logstash service have successfully started and starting to collect the data from each client side. As alternatives, you can use curl command to see the status and updates from logstash side. Below are the examples:
 [[email protected]_master opt]# curl -kL http://172.17.0.6:9200/_cat/indices?v
health status index uuid pri rep docs.count docs.deleted store.size pri.store.size
yellow open filebeat-6.2.1-2018.06.09 dihjTJw3SjGncXYln2MXbA 5 1 6 0 35.2kb 35.2kb
yellow open filebeat-6.2.1-2018.06.04 yPD91Ww0SD2ei4YI-FgLgQ 5 1 350 0 186.4kb 186.4kb
yellow open filebeat-6.2.1-2018.06.08 Qnv0gplFTgW0z1C6haZESg 5 1 97 0 89.4kb 89.4kb
Last but not least, we'll need to setup and configure kibana services to make a complete centralized management server. Just a footnote, as kibana are used to ease the process of gathering and analyzing the data through visualization, it is not an important packages like elasticSearch or logstash if you are setting up the server under a smaller box. Yet to proceed, below are the steps on installation and configuration:
 [[email protected]_master opt]# wget https://artifacts.elastic.co/downloads/kibana/kibana-6.2.1-linux-x86_64.tar.gz
--2018-06-09 13:21:41-- https://artifacts.elastic.co/downloads/kibana/kibana-6.2.1-linux-x86_64.tar.gz
Resolving artifacts.elastic.co (artifacts.elastic.co)... 107.21.237.188, 107.21.237.95, 107.21.253.15, ...
Connecting to artifacts.elastic.co (artifacts.elastic.co)|107.21.237.188|:443... connected.
HTTP request sent, awaiting response... 200 OK
Length: 83465500 (80M) [binary/octet-stream]
Saving to: ‘kibana-6.2.1-linux-x86_64.tar.gz’

100%[==============================================================================>] 83,465,500 2.76MB/s in 41s

2018-06-09 13:22:28 (1.94 MB/s) - ‘kibana-6.2.1-linux-x86_64.tar.gz’ saved [83465500/83465500]

[[email protected]_master opt]# tar -zxvf kibana-6.2.1-linux-x86_64.tar.gz
[[email protected]_master opt]# ln -s /opt/kibana-6.2.1-linux-x86_64 /opt/kibana

[[email protected]_master opt]# vi kibana/config/kibana.yml

server.host: "172.17.0.6"
server.port: 5601
elasticsearch.url: "http://172.17.0.6:9200"
Noted on above that I've link the kibana with our ElasticSearch service inside the configuration and assign a port that will be use by Kibana service once started. Now as everything are already set in place, we can startup the final services. Di seguito sono riportati i passaggi:
 [[email protected]_master opt]# /opt/kibana/bin/kibana --version
6.2.1

[[email protected]_master opt]# /opt/kibana/bin/kibana &
[1] 8640
[[email protected]_master opt]# log [13:26:20.034] [info][status][plugin:[email protected]] Status changed from uninitialized to green - Ready
log [13:26:20.073] [info][status][plugin:[email protected]] Status changed from uninitialized to yellow - Waiting for Elasticsearch
log [13:26:20.193] [info][status][plugin:[email protected]] Status changed from uninitialized to green - Ready
log [13:26:20.200] [info][status][plugin:[email protected]] Status changed from uninitialized to green - Ready
log [13:26:20.212] [info][status][plugin:[email protected]] Status changed from uninitialized to green - Ready
log [13:26:20.233] [info][listening] Server running at http://172.17.0.6:5601
log [13:26:20.276] [info][status][plugin:[email protected]] Status changed from yellow to green - Ready


[[email protected]_master opt]# netstat -apn|grep -i :5601
tcp 0 0 172.17.0.6:5601 0.0.0.0:* LISTEN 8640/node
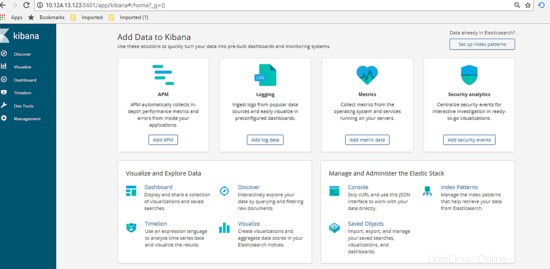
Great, now everything are up and running as per shown above using the netstat command. Now let's view the Dashboard of Kibana and made the configuration. Got to url http://172.17.0.6:5601/app , you'll see the dashboard will be shown like below.
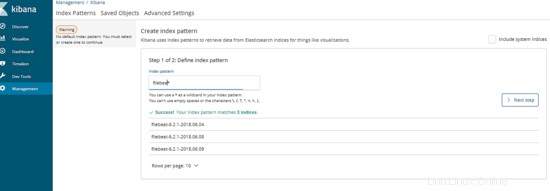
Next on the dashboard, click on Management tab then define the index pattern, for our cases the index pattern are define as our logging filename generated. Type in the information then click next.
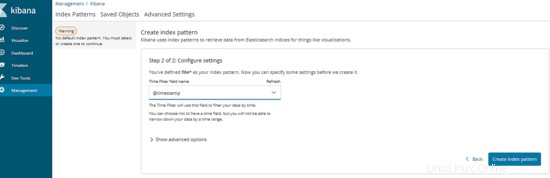
After that, type in the variables that will be use as time series. Once done, click Create Index Pattern. Below are the example:
Excellent, now the management server are ready to be use. Let's proceed by testing the usability.
4. Fase di test
Before we start the test, let's make the assumption for final result expections. For this test, we will try to execute a database query that will pass the long query time assign from client which is MySQL server. Once we execute, our centralized management server should automatically show the result of slow query information as graph via Kibana dashboard. Now as everything is clear, let's start the test, below are the step:
Log into any of the client server and execute the slow query SQL like below:
 [[email protected]_db1 ~]# mysql --login-path=root -P 3306 --prompt='TEST>'
Welcome to the MySQL monitor. Commands end with ; or \g.
Your MySQL connection id is 193
Server version: 5.7.21-log MySQL Community Server (GPL)

Copyright (c) 2000, 2018, Oracle and/or its affiliates. All rights reserved.

Oracle is a registered trademark of Oracle Corporation and/or its
affiliates. Other names may be trademarks of their respective
owners.

Type 'help;' or '\h' for help. Type '\c' to clear the current input statement.

TEST>select sleep(5);
+----------+
| sleep(5) |
+----------+
| 0 |
+----------+
1 row in set (5.01 sec)

TEST>select sleep(6);
+----------+
| sleep(6) |
+----------+
| 0 |
+----------+
1 row in set (6.00 sec)

TEST>select sleep(10) 'run for 10 seconds';
+--------------------+
| run for 10 seconds |
+--------------------+
| 0 |
+--------------------+
1 row in set (10.00 sec)

TEST>select sleep(3) 'test again';
+------------+
| test again |
+------------+
| 0 |
+------------+
1 row in set (3.00 sec)

TEST>exit
Bye
As shown above, we've manage to produce some of slow query that automatically jotted into each client slow query log. Now, let's go to the dashboard and see if the data information successfully been crawl by centralized server and convert it as visualization graph.
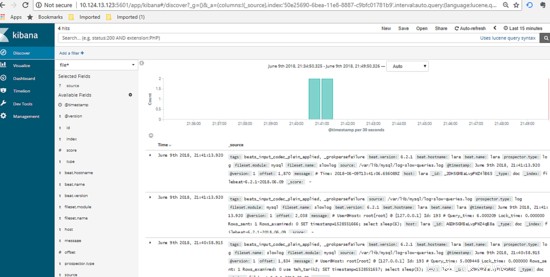
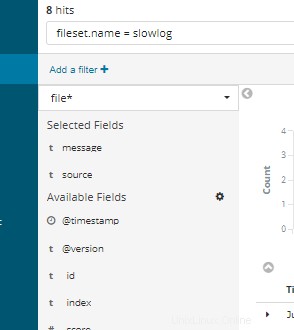
Great, as per shown above there are list of logging information succcessfully been crawl and viewed through kibana dashboard. You can use the left tab to filter what type of column you want to show or hide, below are the example :-
Using the textfield on top of the dashboard, you can type in SQL query related to view certain information or part of the data needed.
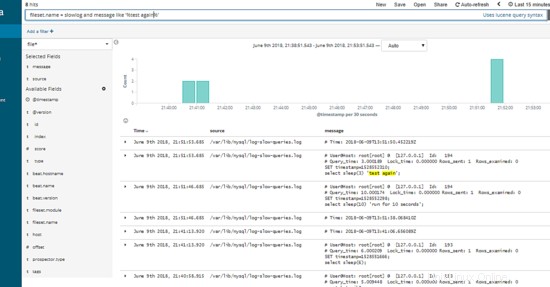
Excellent, as show above the slow query SQL that we've produce initially from 1 of our client server automatically shown under our Kibana Dashboard per expected.