Prometheus è un'applicazione di monitoraggio gratuita, open source e basata sul Web che raccoglie le metriche dai tuoi servizi e le archivia in un database di serie temporali. La configurazione predefinita di Prometheus esporta solo le metriche su se stessa. Ma puoi estenderlo installando esportatori e altri programmi. Supporta un modello di dati multidimensionale, molteplici modalità di rappresentazione grafica e dashboard.
In questo post, ti mostreremo come installare il monitoraggio di Prometheus su Debian 11.
Prerequisiti
- Un server che esegue Debian 11.
- Sul server è configurata una password di root.
Installa Prometheus
Prima di iniziare, si consiglia di creare un utente e un gruppo dedicati per Prometheus. Puoi crearlo usando il seguente comando:
groupadd --system prometheus
useradd -s /sbin/nologin --system -g prometheus prometheus
Quindi, scarica l'ultima versione di Prometheus eseguendo il comando seguente:
curl -s https://api.github.com/repos/prometheus/prometheus/releases/latest|grep browser_download_url|grep linux-amd64|cut -d '"' -f 4|wget -qi -
Una volta scaricato il Prometheus, puoi vedere il file scaricato usando il seguente comando:
ls -l
Dovresti vedere il seguente output:
-rw-r--r-- 1 root root 72638078 Oct 5 16:46 prometheus-2.30.3.linux-amd64.tar.gz
Quindi, estrai il file scaricato usando il seguente comando:
tar -xvf prometheus*.tar.gz
Quindi, cambia la directory nella directory estratta con il seguente comando:
cd prometheus-2.30.3.linux-amd64
Quindi, crea alcune directory richieste usando il seguente comando:
mkdir /etc/prometheus
mkdir /var/lib/prometheus
Quindi, copia i file di configurazione e gli strumenti richiesti con i seguenti comandi:
mv prometheus.yml /etc/prometheus/prometheus.yml
mv consoles/ console_libraries/ /etc/prometheus/
mv prometheus promtool /usr/local/bin/
Una volta terminato, puoi procedere al passaggio successivo.
Crea un file di servizio Systemd per Prometheus
Successivamente, dovrai creare un file di servizio systemd per gestire il servizio Prometheus. Puoi crearlo eseguendo il seguente comando:
nano /etc/systemd/system/prometheus.service
Aggiungi le seguenti righe:
[Unit]
Description=Prometheus
Documentation=https://prometheus.io/docs/introduction/overview/
Wants=network-online.target
After=network-online.target

[Service]
Type=simple
User=prometheus
Group=prometheus
ExecReload=/bin/kill -HUP $MAINPID
ExecStart=/usr/local/bin/prometheus \
  --config.file=/etc/prometheus/prometheus.yml \
  --storage.tsdb.path=/var/lib/prometheus \
  --web.console.templates=/etc/prometheus/consoles \
  --web.console.libraries=/etc/prometheus/console_libraries \
  --web.listen-address=0.0.0.0:9090 \
  --web.external-url=

SyslogIdentifier=prometheus
Restart=always

[Install]
WantedBy=multi-user.target
Salva e chiudi il file, quindi imposta la proprietà e l'autorizzazione appropriate per la directory di configurazione di Prometheus:
chown -R prometheus:prometheus /etc/prometheus/
chmod -R 775 /etc/prometheus/
chown -R prometheus:prometheus /var/lib/prometheus/
Quindi, ricarica il demone systemd per applicare le modifiche:
systemctl daemon-reload
Quindi, avvia il servizio Prometheus e abilitalo all'avvio al riavvio del sistema utilizzando il seguente comando:
systemctl start prometheus
systemctl enable prometheus
Puoi controllare lo stato del Prometheus con il seguente comando:
systemctl status prometheus
Otterrai il seguente output:
? prometheus.service - Prometheus
     Loaded: loaded (/etc/systemd/system/prometheus.service; disabled; vendor preset: enabled)
     Active: active (running) since Sat 2021-10-16 14:06:39 UTC; 4s ago
       Docs: https://prometheus.io/docs/introduction/overview/
   Main PID: 18415 (prometheus)
      Tasks: 5 (limit: 2341)
     Memory: 19.6M
        CPU: 79ms
     CGroup: /system.slice/prometheus.service
             ??18415 /usr/local/bin/prometheus --config.file=/etc/prometheus/prometheus.yml --storage.tsdb.path=/var/lib/prometheus --web.cons>

Oct 16 14:06:39 debian11 prometheus[18415]: level=info ts=2021-10-16T14:06:39.172Z caller=head.go:513 component=tsdb msg="On-disk memory mappa>
Oct 16 14:06:39 debian11 prometheus[18415]: level=info ts=2021-10-16T14:06:39.172Z caller=head.go:519 component=tsdb msg="Replaying WAL, this >
Oct 16 14:06:39 debian11 prometheus[18415]: level=info ts=2021-10-16T14:06:39.174Z caller=head.go:590 component=tsdb msg="WAL segment loaded" >
Oct 16 14:06:39 debian11 prometheus[18415]: level=info ts=2021-10-16T14:06:39.174Z caller=head.go:596 component=tsdb msg="WAL replay completed>
Oct 16 14:06:39 debian11 prometheus[18415]: level=info ts=2021-10-16T14:06:39.177Z caller=main.go:849 fs_type=EXT4_SUPER_MAGIC
Oct 16 14:06:39 debian11 prometheus[18415]: level=info ts=2021-10-16T14:06:39.177Z caller=main.go:852 msg="TSDB started"
Oct 16 14:06:39 debian11 prometheus[18415]: level=info ts=2021-10-16T14:06:39.178Z caller=main.go:979 msg="Loading configuration file" filenam>
Oct 16 14:06:39 debian11 prometheus[18415]: level=info ts=2021-10-16T14:06:39.178Z caller=main.go:1016 msg="Completed loading of configuration>
Oct 16 14:06:39 debian11 prometheus[18415]: level=info ts=2021-10-16T14:06:39.179Z caller=main.go:794 msg="Server is ready to receive web requ>
Oct 16 14:06:39 debian11 prometheus[18415]: level=info ts=2021-10-16T14:06:39.179Z caller=tls_config.go:191 component=web msg="TLS is disabled>
Per impostazione predefinita, Prometheus è in ascolto sulla porta 9090. Puoi verificarlo utilizzando il seguente comando:
ss -antpl | grep 9090
Dovresti vedere il seguente output:
LISTEN 0 4096 *:9090 *:* users:(("prometheus",pid=18415,fd=7))
Una volta terminato, puoi procedere al passaggio successivo.
Configura Nginx come proxy inverso per Prometheus
Successivamente, si consiglia di installare e configurare Nginx come proxy inverso per Prometheus. Innanzitutto, installa il pacchetto del server web Nginx usando il seguente comando:
apt-get install nginx -y
Una volta installato Nginx, crea un file di configurazione dell'host virtuale Nginx con il seguente comando:
nano /etc/nginx/conf.d/prometheus.conf
Aggiungi le seguenti righe:
server {
    listen 80;
    server_name prometheus.example.com;
    location / {
        proxy_pass http://localhost:9090;
        proxy_http_version 1.1;
        proxy_set_header Upgrade $http_upgrade;
        proxy_set_header Connection 'upgrade';
        proxy_set_header Host $host;
        proxy_cache_bypass $http_upgrade;
    }

}
Salva e chiudi il file, quindi verifica Nginx per eventuali errori di sintassi con il seguente comando:
nginx -t
Se tutto va bene, otterrai il seguente output:
nginx: configuration file /etc/nginx/nginx.conf test is successful
Infine, riavvia il servizio Nginx per applicare le modifiche:
systemctl restart nginx
Puoi anche verificare lo stato del servizio Nginx usando il seguente comando:
systemctl status nginx
Dovresti ottenere il seguente output:
? nginx.service - A high performance web server and a reverse proxy server
     Loaded: loaded (/lib/systemd/system/nginx.service; enabled; vendor preset: enabled)
     Active: active (running) since Sat 2021-10-16 14:08:15 UTC; 2s ago
       Docs: man:nginx(8)
    Process: 18792 ExecStartPre=/usr/sbin/nginx -t -q -g daemon on; master_process on; (code=exited, status=0/SUCCESS)
    Process: 18793 ExecStart=/usr/sbin/nginx -g daemon on; master_process on; (code=exited, status=0/SUCCESS)
   Main PID: 18794 (nginx)
      Tasks: 2 (limit: 2341)
     Memory: 2.5M
        CPU: 35ms
     CGroup: /system.slice/nginx.service
             ??18794 nginx: master process /usr/sbin/nginx -g daemon on; master_process on;
             ??18795 nginx: worker process

Oct 16 14:08:15 debian11 systemd[1]: Starting A high performance web server and a reverse proxy server...
Oct 16 14:08:15 debian11 systemd[1]: nginx.service: Failed to parse PID from file /run/nginx.pid: Invalid argument
Oct 16 14:08:15 debian11 systemd[1]: Started A high performance web server and a reverse proxy server.
A questo punto, Nginx è installato e configurato per servire il Prometheus. Ora puoi procedere al passaggio successivo.
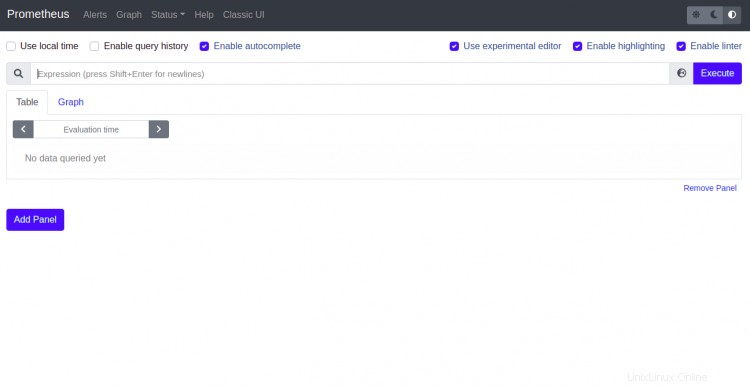
Accedi al dashboard di Prometheus
Ora apri il tuo browser web e accedi alla dashboard di Prometheus utilizzando l'URL http://prometheus.example.com . Dovresti vedere la seguente pagina:
Installa e configura node_exporter
node_exporter è un esportatore che monitorerà e otterrà la metrica del server Prometheus. Innanzitutto, scarica l'ultima versione di node_exporter utilizzando il comando seguente:
wget https://github.com/prometheus/node_exporter/releases/download/v1.2.2/node_exporter-1.2.2.linux-amd64.tar.gz
Una volta completato il download, estrai il file scaricato con il seguente comando:
tar -xvzf node_exporter-1.2.2.linux-amd64.tar.gz
Quindi, sposta la directory estratta nella directory /etc/prometheus/:
mv node_exporter-1.2.2.linux-amd64 /etc/prometheus/node_exporter
Quindi, imposta la proprietà corretta con il seguente comando:
chown -R prometheus:prometheus /etc/prometheus/node_exporter
Quindi, crea un file di servizio systemd per gestire il servizio node_exporter:
nano /etc/systemd/system/node_exporter.service
Aggiungi le seguenti righe:
[Unit]
Description=Node Exporter
Wants=network-online.target
After=network-online.target

[Service]
User=prometheus
ExecStart=/etc/prometheus/node_exporter/node_exporter

[Install]
WantedBy=default.target
Salva e chiudi il file, quindi ricarica il demone systemd per applicare le modifiche:
systemctl daemon-reload
Quindi, avvia il servizio node_exporter e abilitalo per l'avvio al riavvio del sistema:
systemctl start node_exporter
systemctl enable node_exporter
Puoi controllare lo stato di node_exporter con il seguente comando:
systemctl status node_exporter
Otterrai il seguente output:
? node_exporter.service - Node Exporter
     Loaded: loaded (/etc/systemd/system/node_exporter.service; disabled; vendor preset: enabled)
     Active: active (running) since Sun 2021-10-17 05:38:20 UTC; 4s ago
   Main PID: 513 (node_exporter)
      Tasks: 4 (limit: 2341)
     Memory: 4.7M
        CPU: 11ms
     CGroup: /system.slice/node_exporter.service
             ??513 /etc/prometheus/node_exporter/node_exporter

Oct 17 05:38:20 debian11 node_exporter[513]: level=info ts=2021-10-17T05:38:20.382Z caller=node_exporter.go:115 collector=thermal_zone
Oct 17 05:38:20 debian11 node_exporter[513]: level=info ts=2021-10-17T05:38:20.382Z caller=node_exporter.go:115 collector=time
Oct 17 05:38:20 debian11 node_exporter[513]: level=info ts=2021-10-17T05:38:20.382Z caller=node_exporter.go:115 collector=timex
Oct 17 05:38:20 debian11 node_exporter[513]: level=info ts=2021-10-17T05:38:20.382Z caller=node_exporter.go:115 collector=udp_queues
Oct 17 05:38:20 debian11 node_exporter[513]: level=info ts=2021-10-17T05:38:20.382Z caller=node_exporter.go:115 collector=uname
Oct 17 05:38:20 debian11 node_exporter[513]: level=info ts=2021-10-17T05:38:20.382Z caller=node_exporter.go:115 collector=vmstat
Oct 17 05:38:20 debian11 node_exporter[513]: level=info ts=2021-10-17T05:38:20.382Z caller=node_exporter.go:115 collector=xfs
Oct 17 05:38:20 debian11 node_exporter[513]: level=info ts=2021-10-17T05:38:20.382Z caller=node_exporter.go:115 collector=zfs
Oct 17 05:38:20 debian11 node_exporter[513]: level=info ts=2021-10-17T05:38:20.383Z caller=node_exporter.go:199 msg="Listening on" address=:91>
Oct 17 05:38:20 debian11 node_exporter[513]: level=info ts=2021-10-17T05:38:20.383Z caller=tls_config.go:191 msg="TLS is disabled." http2=false
Per impostazione predefinita, node_exporter è in ascolto sulla porta 9100. Puoi verificarlo con il seguente comando:
ss -antpl | grep 9100
Dovresti ottenere il seguente output:
LISTEN 0 4096 *:9100 *:* users:(("node_exporter",pid=513,fd=3))
Aggiungi node_exporter al server Prometheus
Successivamente, dovrai aggiungere node_exporter al file di configurazione di Prometheus. Puoi farlo modificando il file di configurazione predefinito di Prometheus:
nano /etc/prometheus/prometheus.yml
Sotto 'scrape_config ', aggiungi un nuovo nome_lavoro node_exporter aggiungendo le seguenti righe.
  - job_name: 'node_exporter'
    static_configs:
    - targets: ['localhost:9100']
Salva e chiudi il file, quindi riavvia il servizio Prometheus per applicare le modifiche:
systemctl restart prometheus
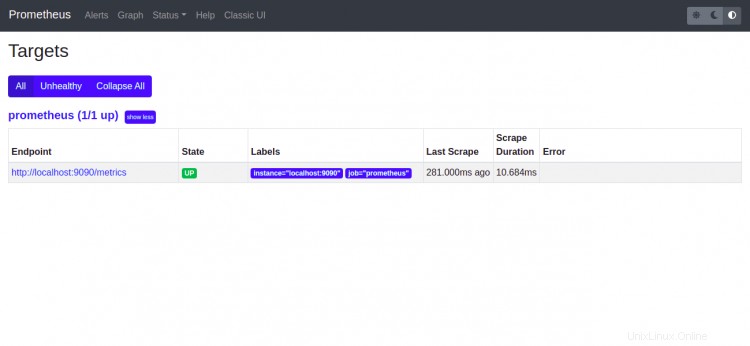
Verifica Prometheus e node_exporter
Ora vai alla dashboard di Prometheus e fai clic su Stato => Target . Dovresti vedere il tuo node_exporter nella schermata seguente:
Ora torna alla home page di Prometheus e digita node_memory_MemAvailable_bytes nel campo della query e fai clic su 'Esegui pulsante '. Otterrai il seguente risultato:

Puoi anche ottenere il node_exporter dati delle metriche utilizzando l'URL http://your-server-ip:9100/metrics come mostrato di seguito:

Conclusione
Congratulazioni! hai installato con successo Prometheus con node_exporter su Debian 11. Sentiti libero di chiedermi se hai qualche domanda. Per ulteriori informazioni, visita la documentazione ufficiale di Prometheus.